 HireFly Blog
HR Strategy Map: Connecting People Priorities to Business Outcomes
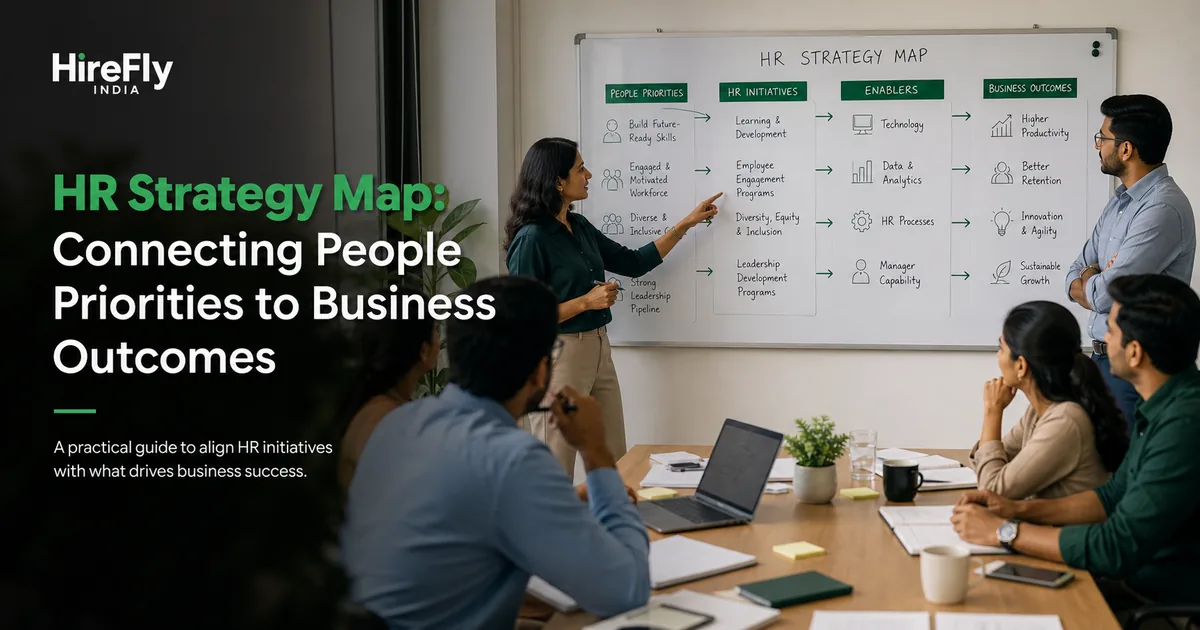
An HR strategy map shows how a small set of people priorities is expected to contribute to capabilities, operating outcomes and business results. It makes assumptions visible; it does not prove that HR alone caused a financial result.
Begin with the business choices
Identify the few outcomes and risks that matter over the planning horizon: growth, service, productivity, quality, innovation, cost or resilience. Use the business plan and leader evidence rather than generic HR themes.
Define required capabilities
Ask what the organisation must be able to do differently. Examples include opening sites reliably, improving first-line decisions, retaining a scarce technical capability or standardising a control. A capability is more specific than “engaged employees”.
Identify workforce conditions
Map the roles, skills, leadership, organisation, capacity, experience or systems needed for each capability. Distinguish conditions HR can influence directly from operational factors owned elsewhere.
Select people priorities
Choose interventions with a plausible connection to the capability: role redesign, targeted hiring, manager practice, learning, reward, mobility or process changes. Avoid adding every HR programme to the map.
Write cause-and-effect hypotheses
State the expected chain in plain language. For example: clearer service roles and supervised practice should reduce hand-off errors, which should improve resolution time. Record assumptions and competing explanations.
Assign measures by level
Use delivery evidence, capability indicators, operating outcomes and business measures without collapsing them into one score. Training completion can show delivery; observed task competence is closer to capability; customer resolution is an operating result.
Name owners and dependencies
HR may own an intervention while business leaders own work allocation and reinforcement. Show finance, technology, manager or facility dependencies and the decision date attached to each.
Use the map for choices
Review whether initiatives still support the strategy, whether assumptions hold and which work should stop. Do not use arrows merely to decorate an HR presentation.
Example
A service business plans regional growth. The map links workforce forecasting, manager selection and role-based onboarding to faster site readiness and stable customer service, while operations owns process capacity and site execution.
Distinguish a strategy map from an HR plan
The map explains why selected people priorities should influence outcomes. The annual plan states projects, milestones, resources and timing. Keep the map stable enough to test strategic logic while delivery plans adapt.
Test weak links
Ask what evidence would show that a connection is wrong. If trained managers still lack authority to resolve service issues, more learning may not improve the operating result. Revise the intervention or business dependency rather than defending the diagram.
Avoid claiming causation too early
Business outcomes reflect market, operations and many other factors. Use contribution language and intermediate evidence. A change in retention after a programme does not prove the programme caused it without deeper analysis.
Govern updates
Name who approves strategy-map changes and when executives review assumptions. Preserve versions so changing priorities are visible. Use the map in investment, workforce and initiative-stop decisions, not only the annual HR presentation.
The map is valuable when leaders can challenge the logic and use it to allocate resources—not when every desirable outcome appears connected to HR.